SAMSON Forum
    • Login
    • Search
    • Recent
    • Tags
    • Popular
    • SAMSON Connect
    • Get SAMSON

    Tips for depicting binding pockets?

    SAMSON
    2
    3
    667
    Loading More Posts
    • Oldest to Newest
    • Newest to Oldest
    • Most Votes
    Reply
    • Reply as topic
    Log in to reply
    This topic has been deleted. Only users with topic management privileges can see it.
    • C
      Chris 1 last edited by

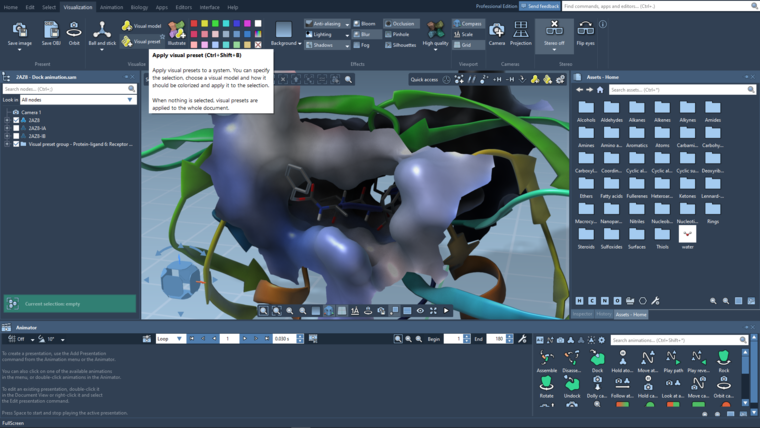
      I am trying to visualize the surface around a bound ligand (binding pocket), in this case within a GPCR. Any tips for doing this? I am trying to mimic some of the features of PyMOL for showing ligand sites. Thanks!

      1 Reply Last reply Reply Quote 0
      • Admin
        Admin last edited by

        Hi Chris,

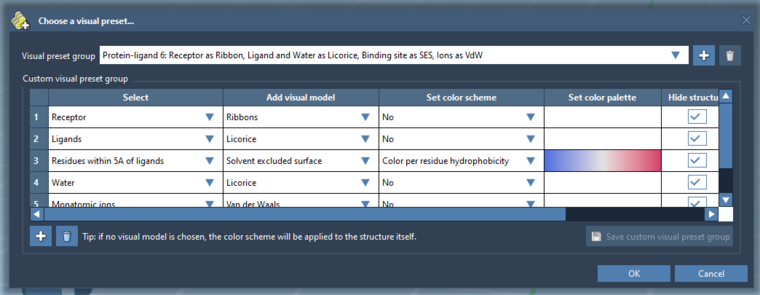
        You can use Visual Preset 6 to automatically represent the binding site as SES, for example:
        0_1645313022471_2492a9c3-00bb-452f-96c0-69d7bf307aab-image.png

        Visual presets are found in the Visualization menu:
        0_1645313044435_6e2231d5-bc1c-4584-94bd-8946a3b2968e-image.png
        0_1645313068970_5ac9b043-90eb-4af0-8810-650fd9d1cb5e-image.png

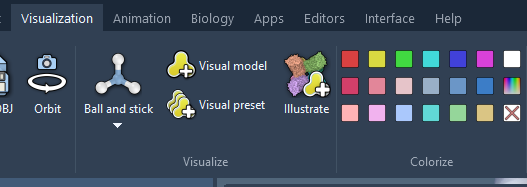
        Note that you can create and save your own visual presets: choose selectors (to automatically select specific things in the document), visual models, color schemes and color palettes.

        1 Reply Last reply Reply Quote 0
        • C
          Chris 1 last edited by

          Great, thanks! I will also mess with transparency, etc. in order to see some interactions in more detail.

          1 Reply Last reply Reply Quote 0
          • First post
            Last post